Sound
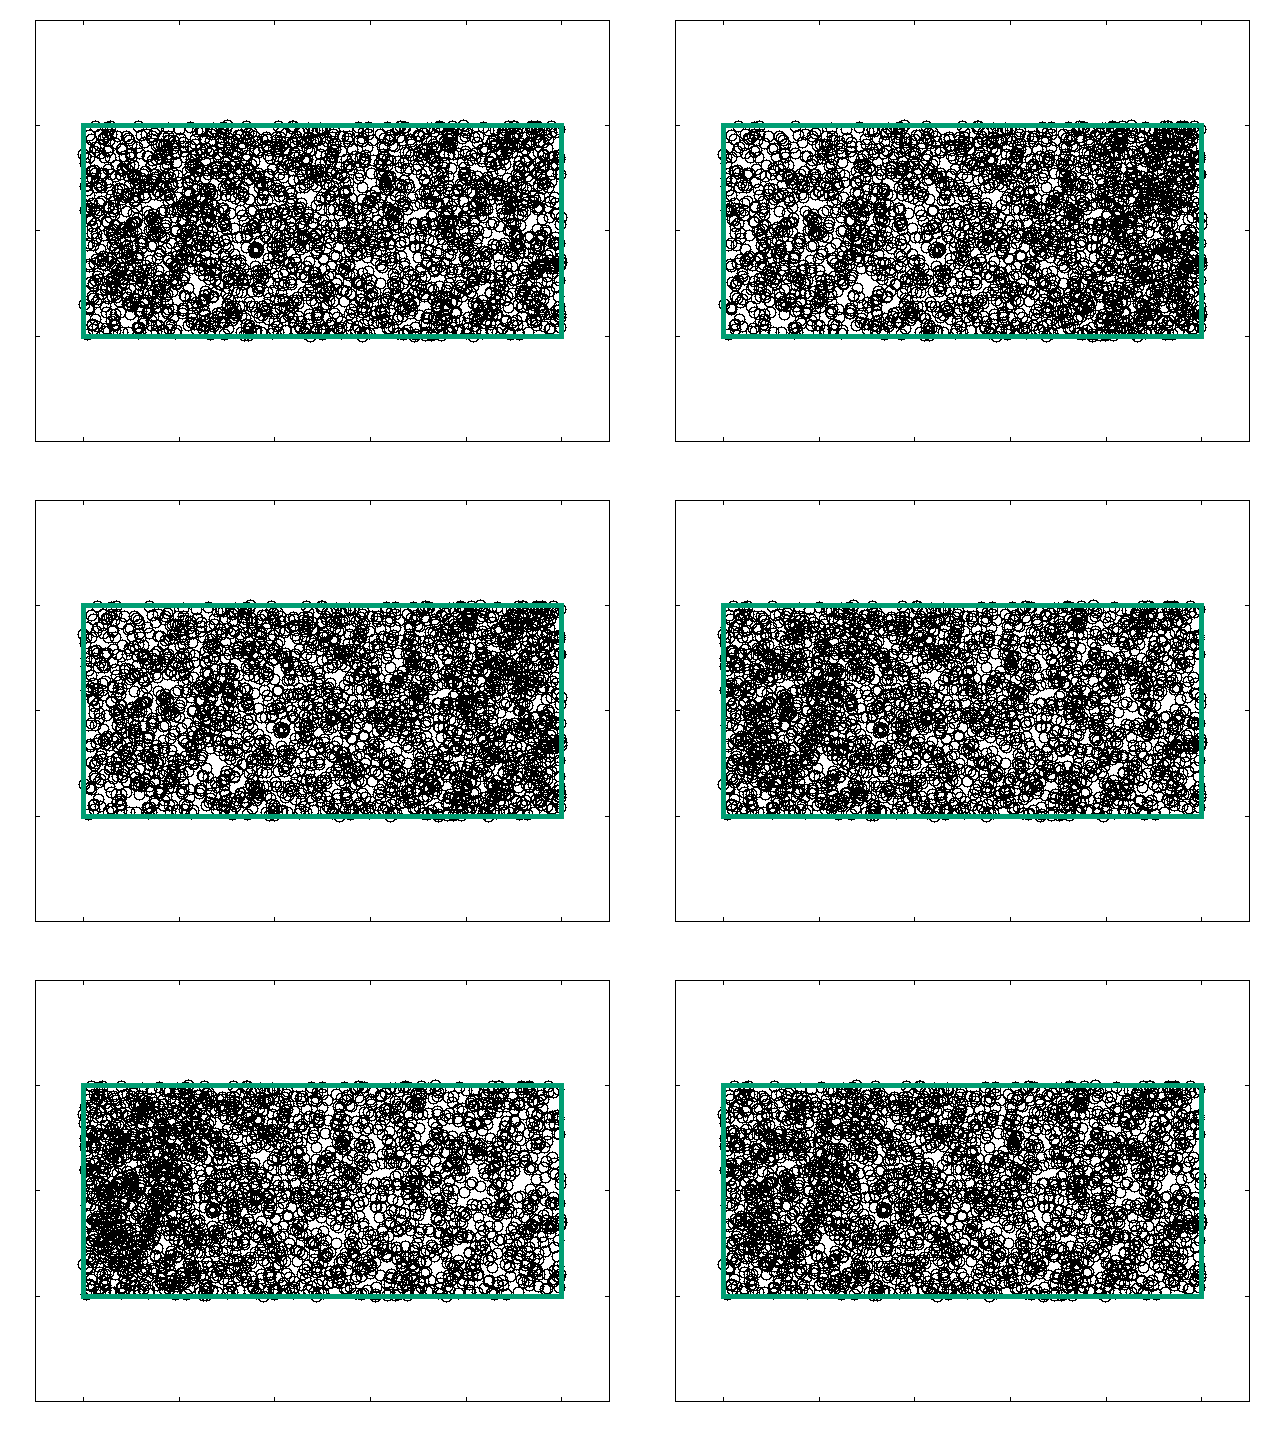
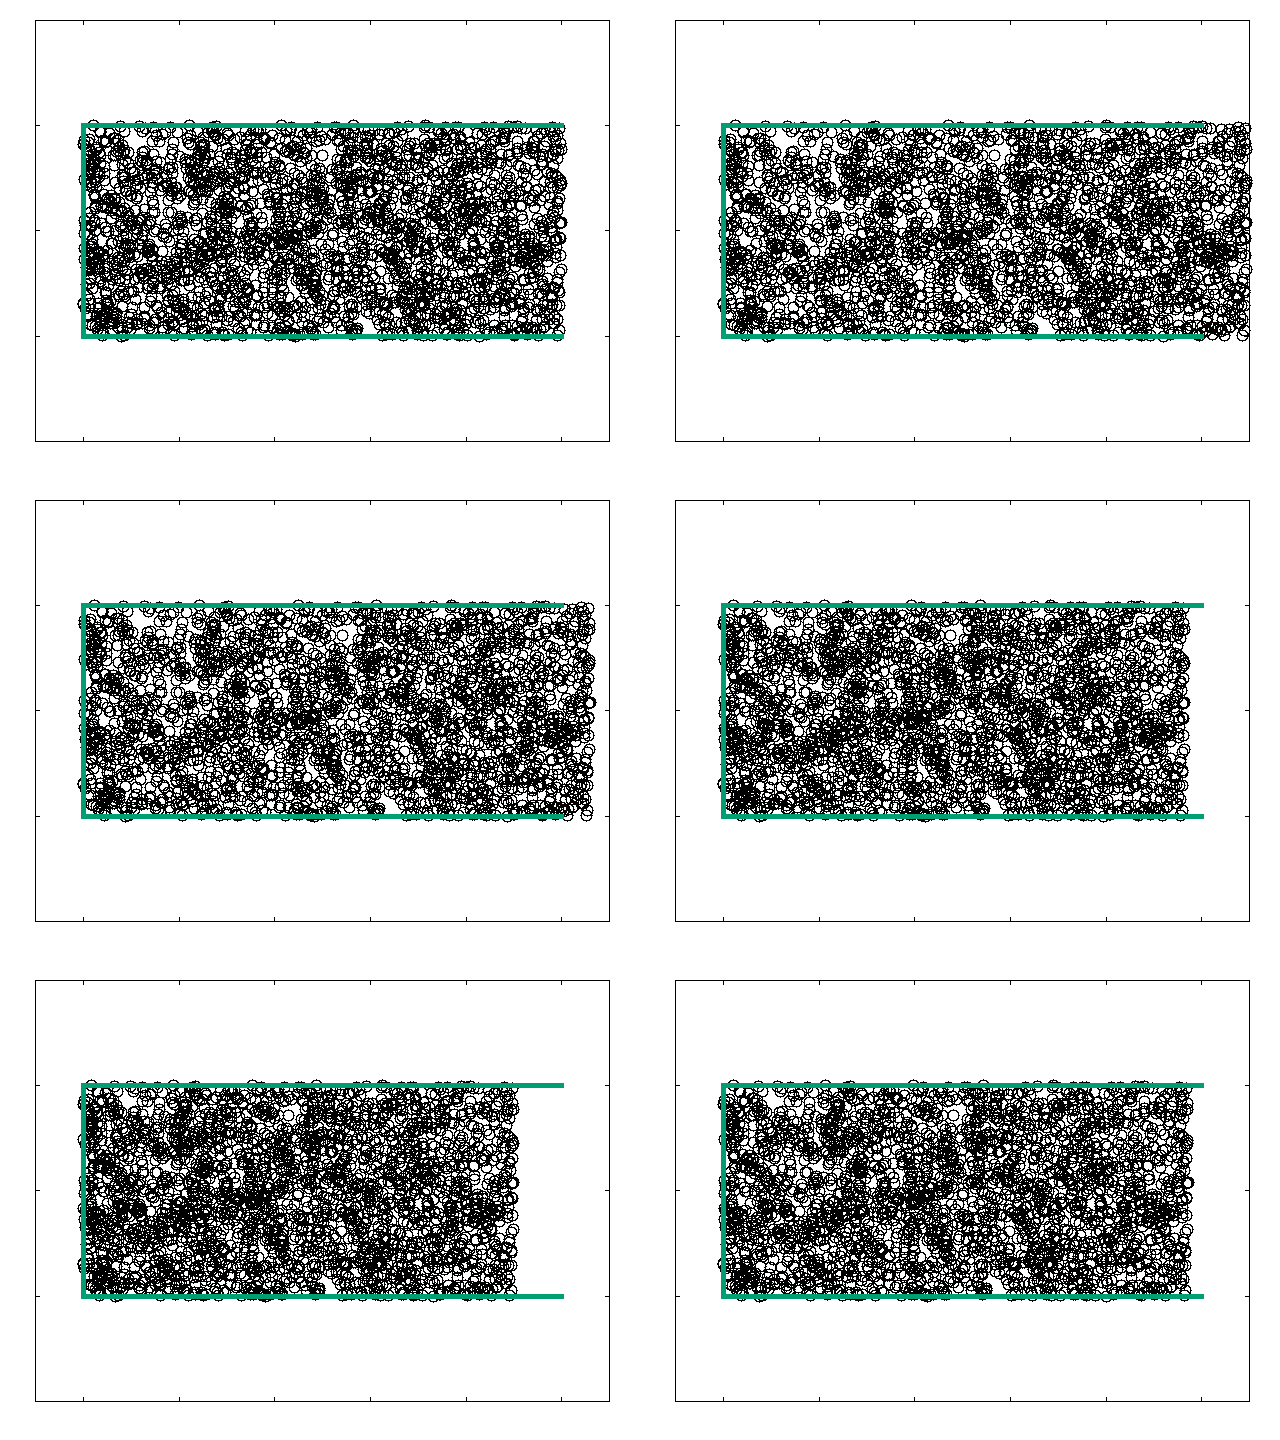
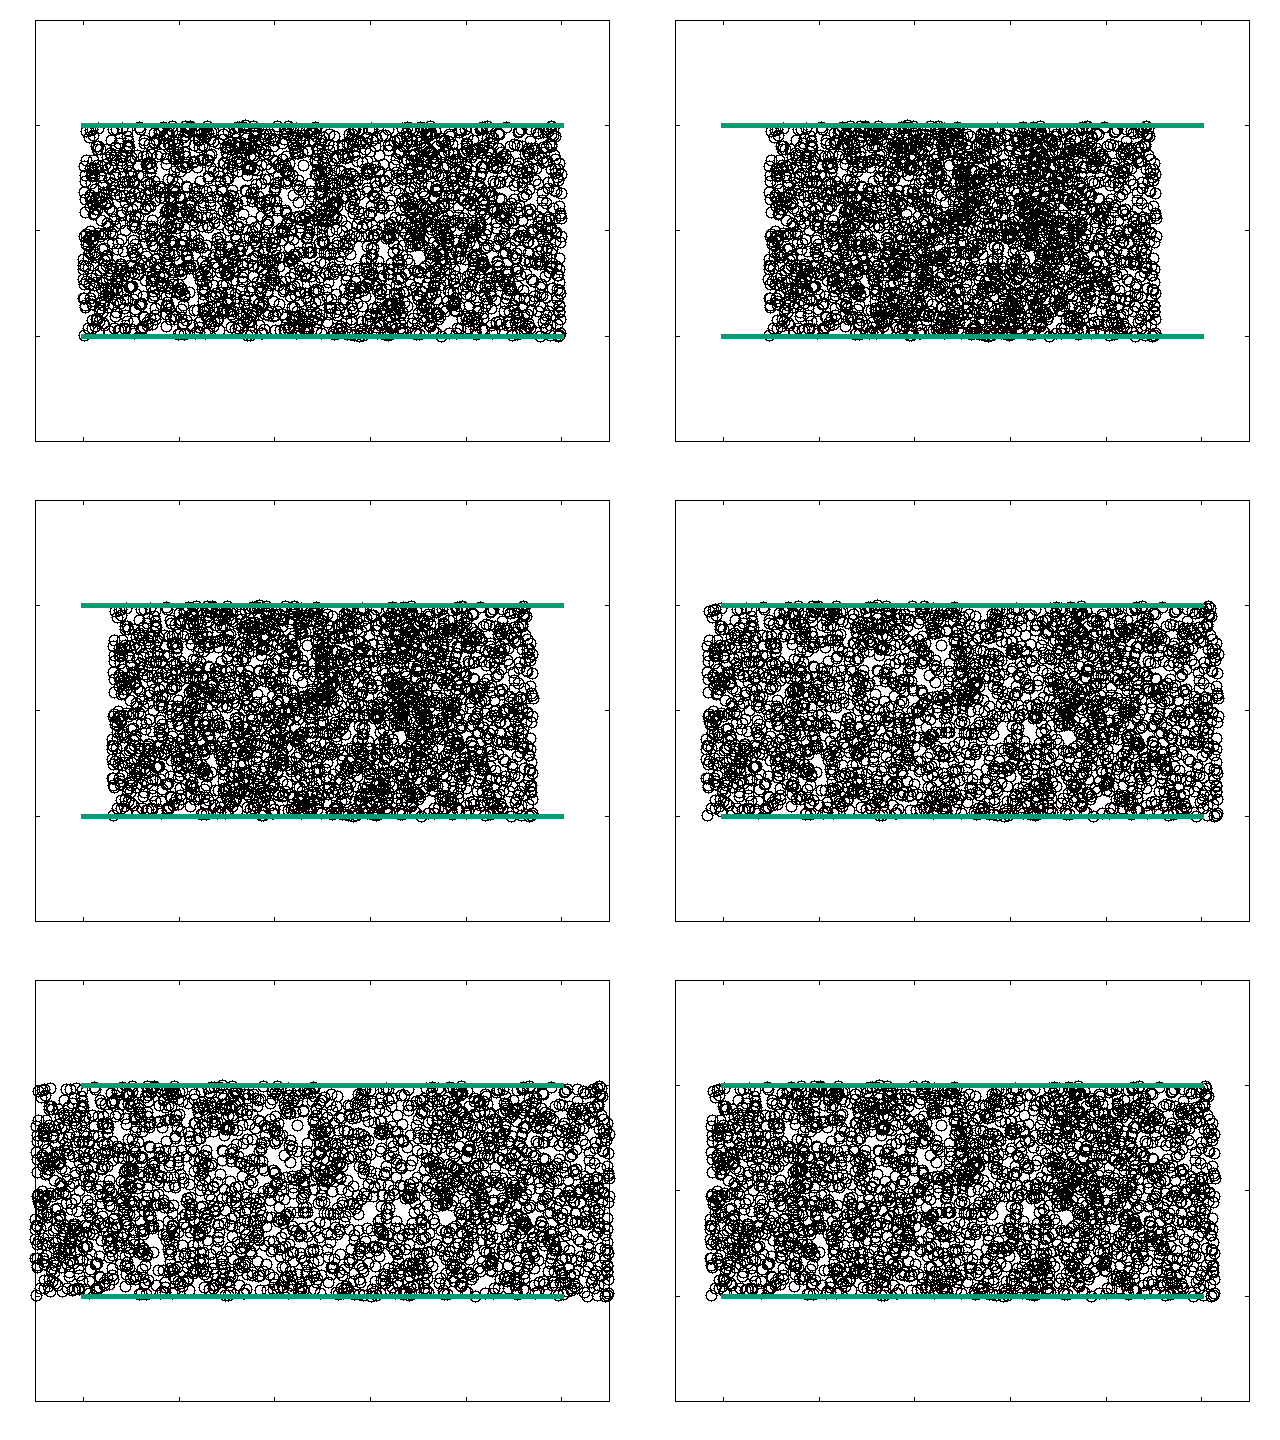
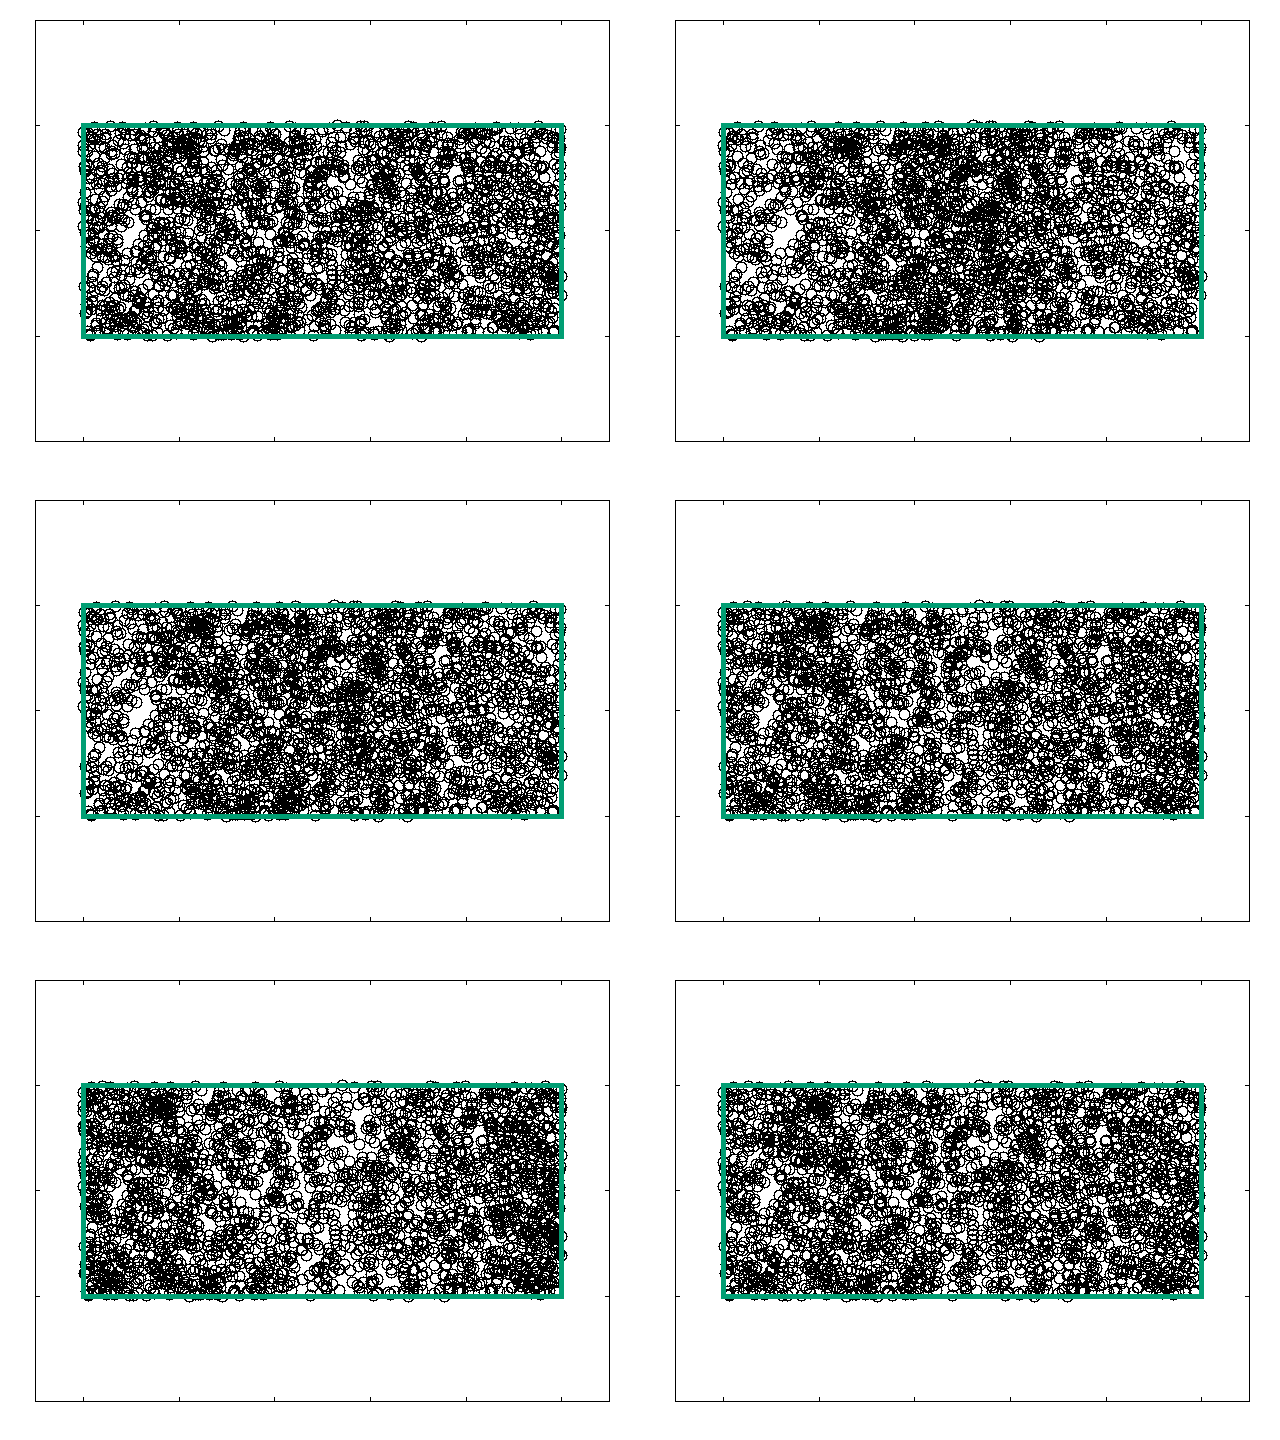
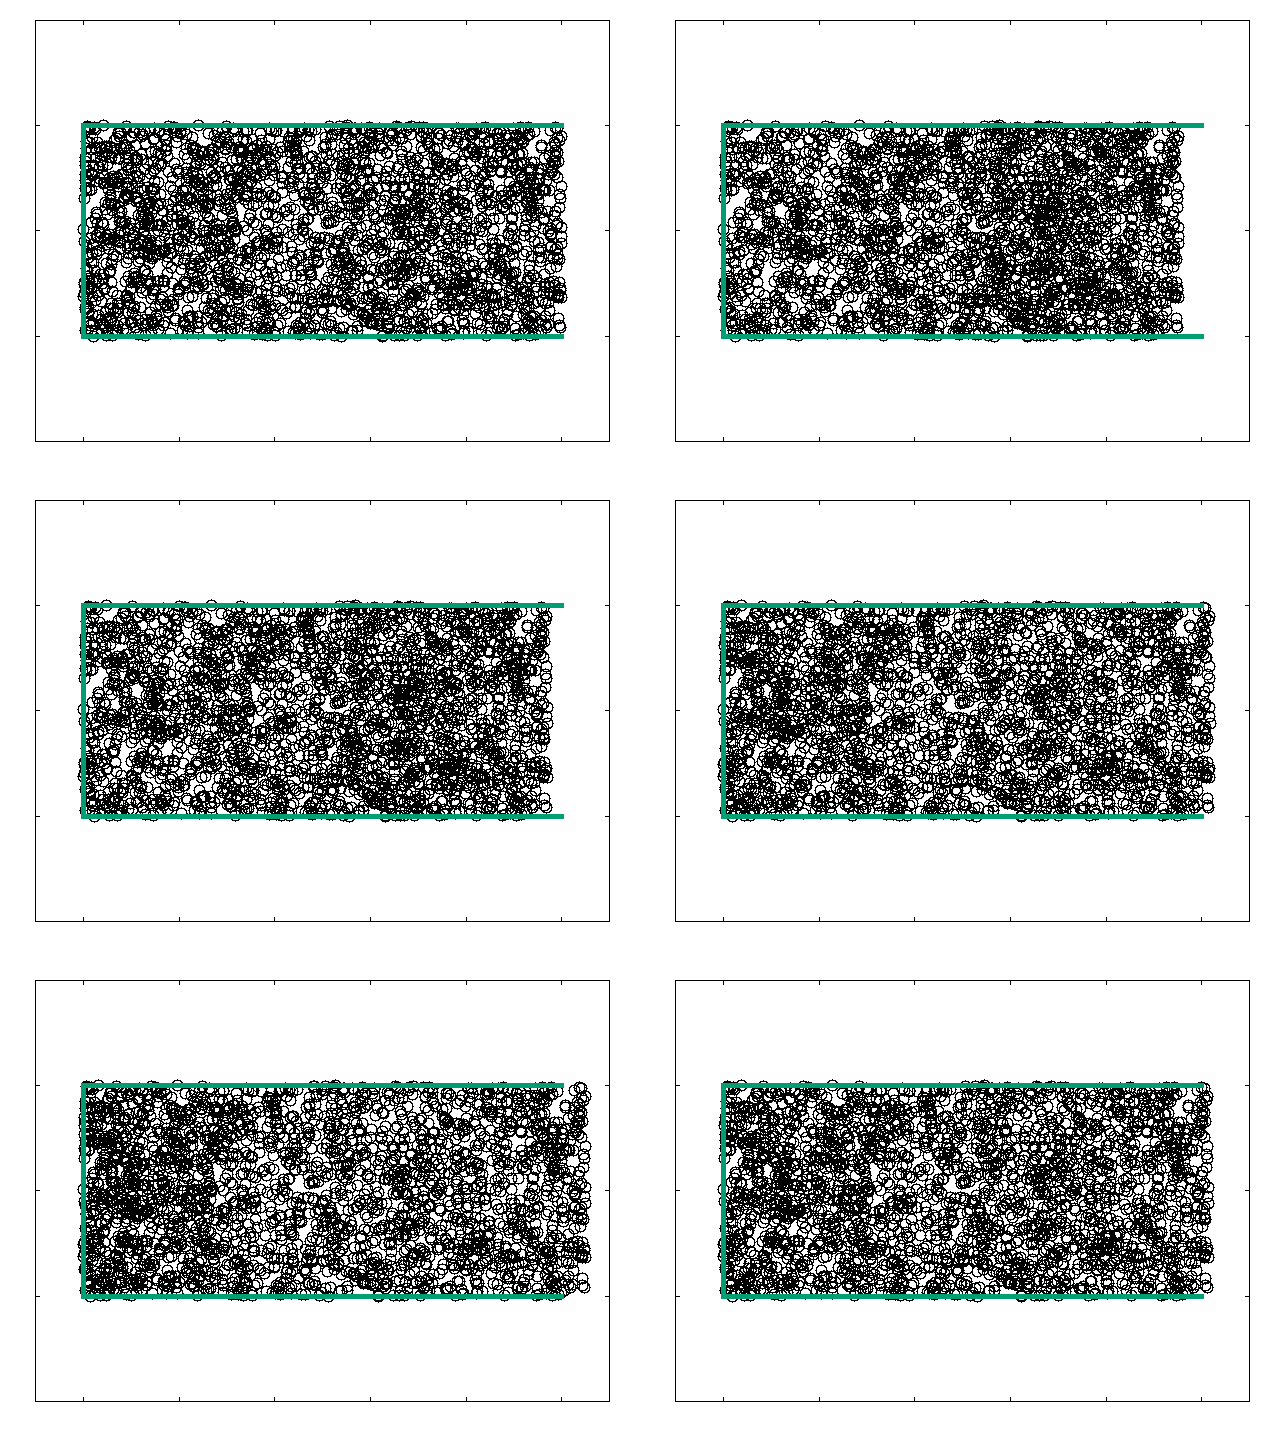
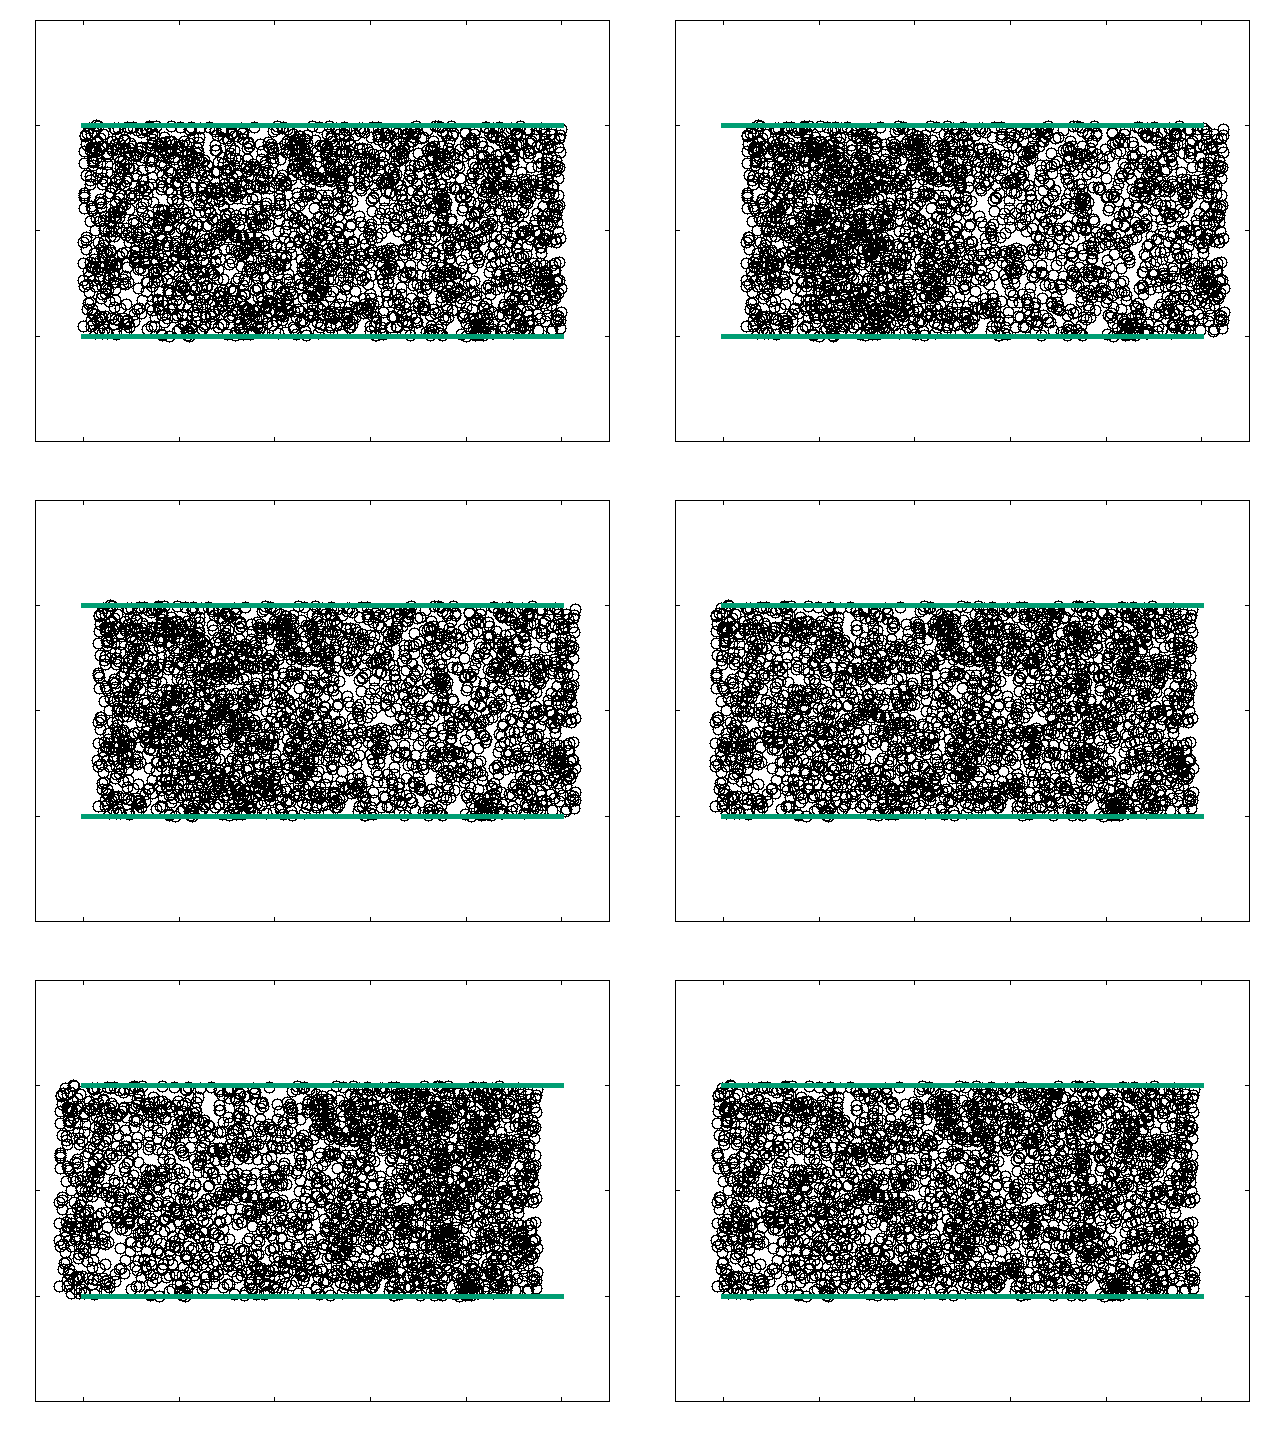
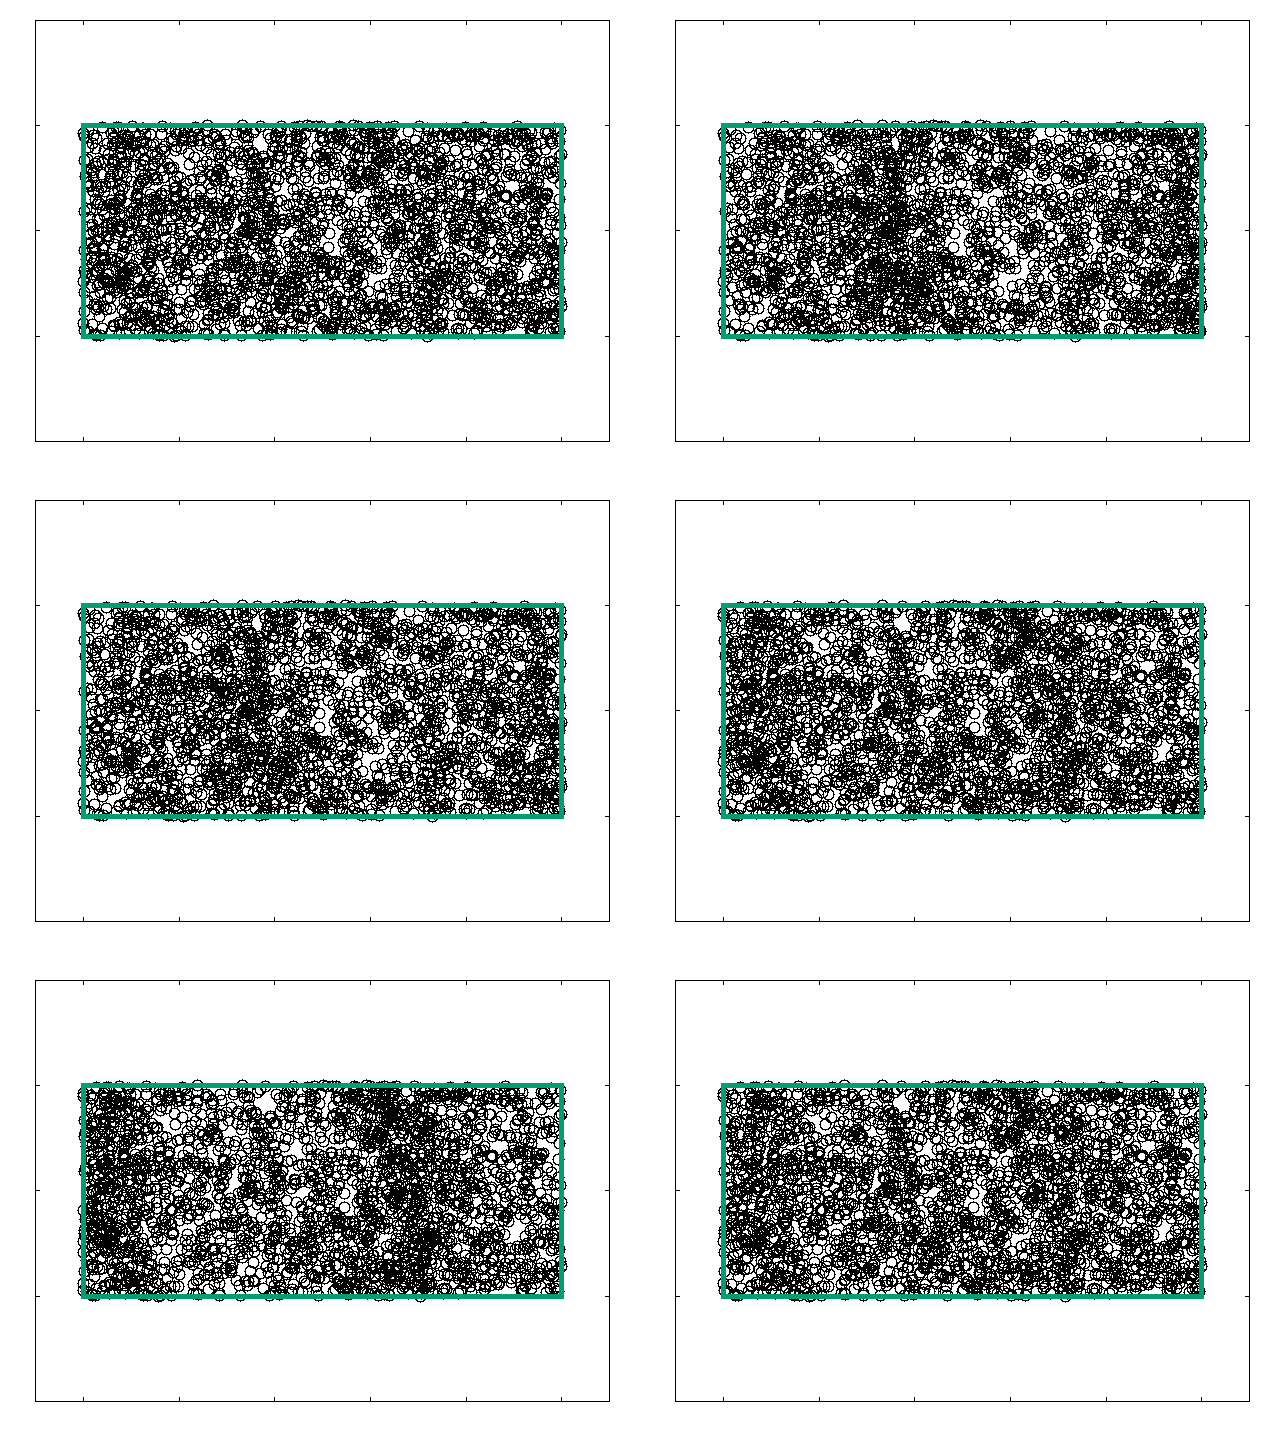
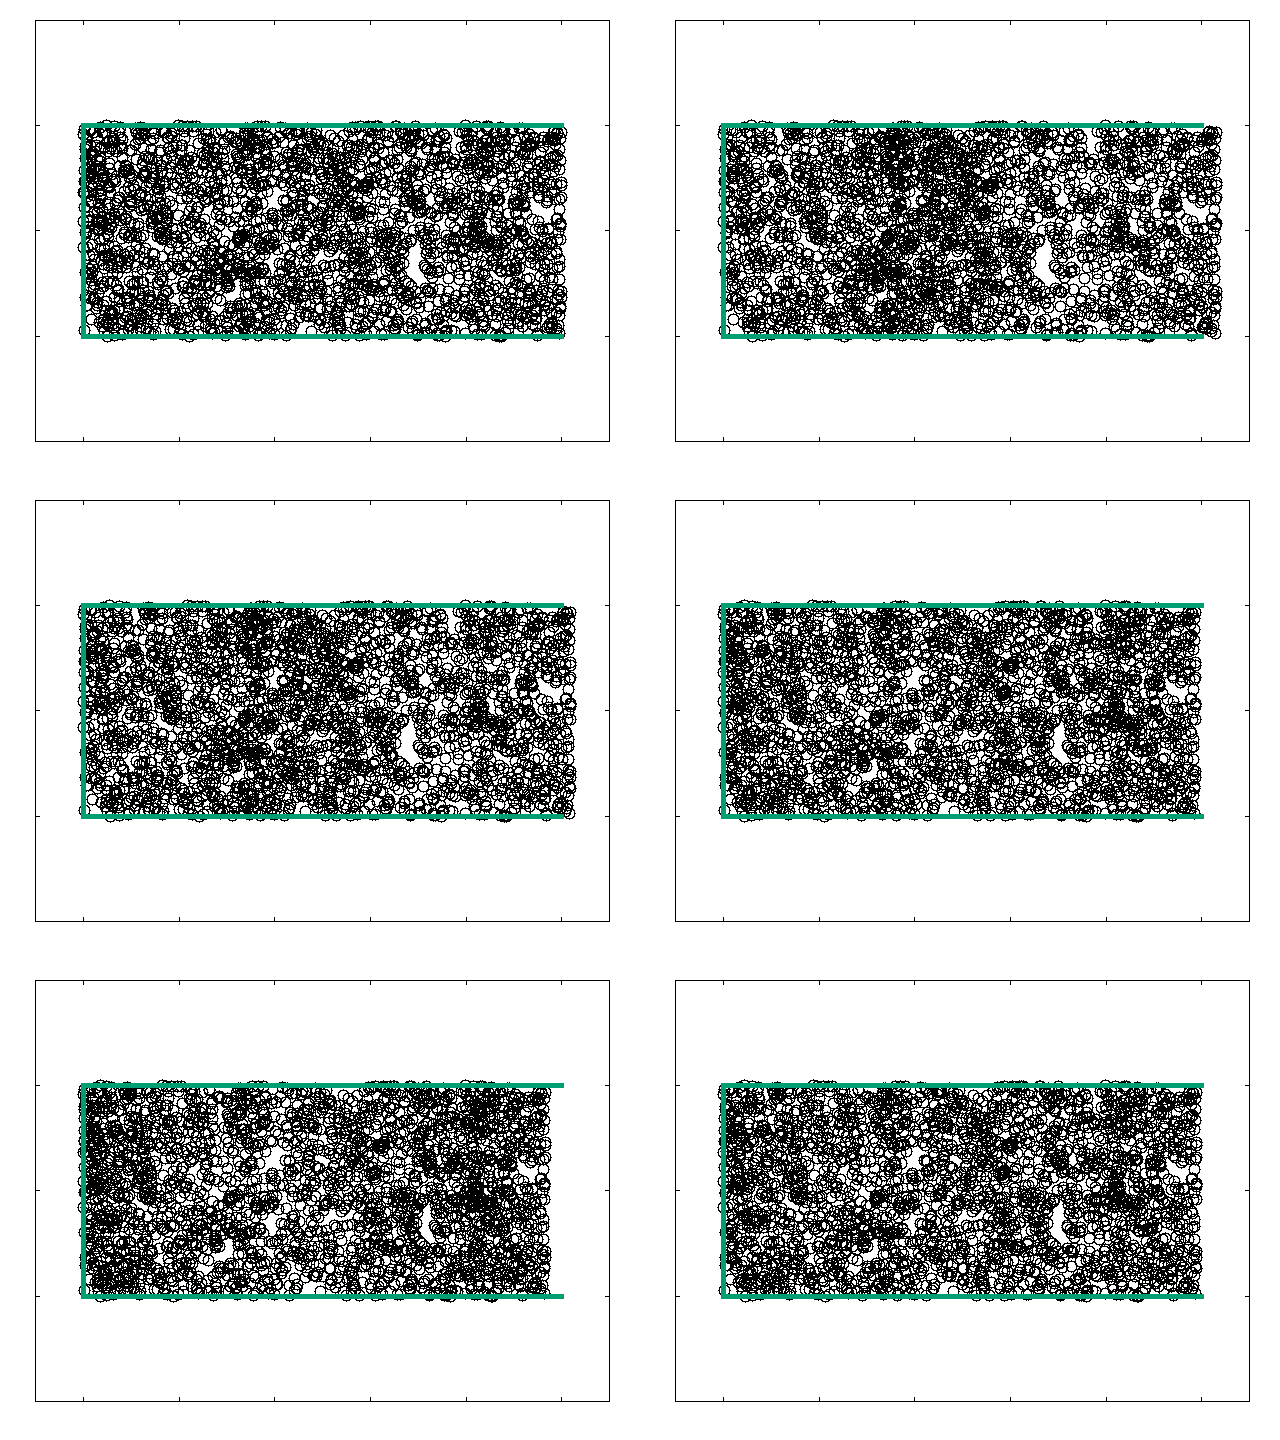
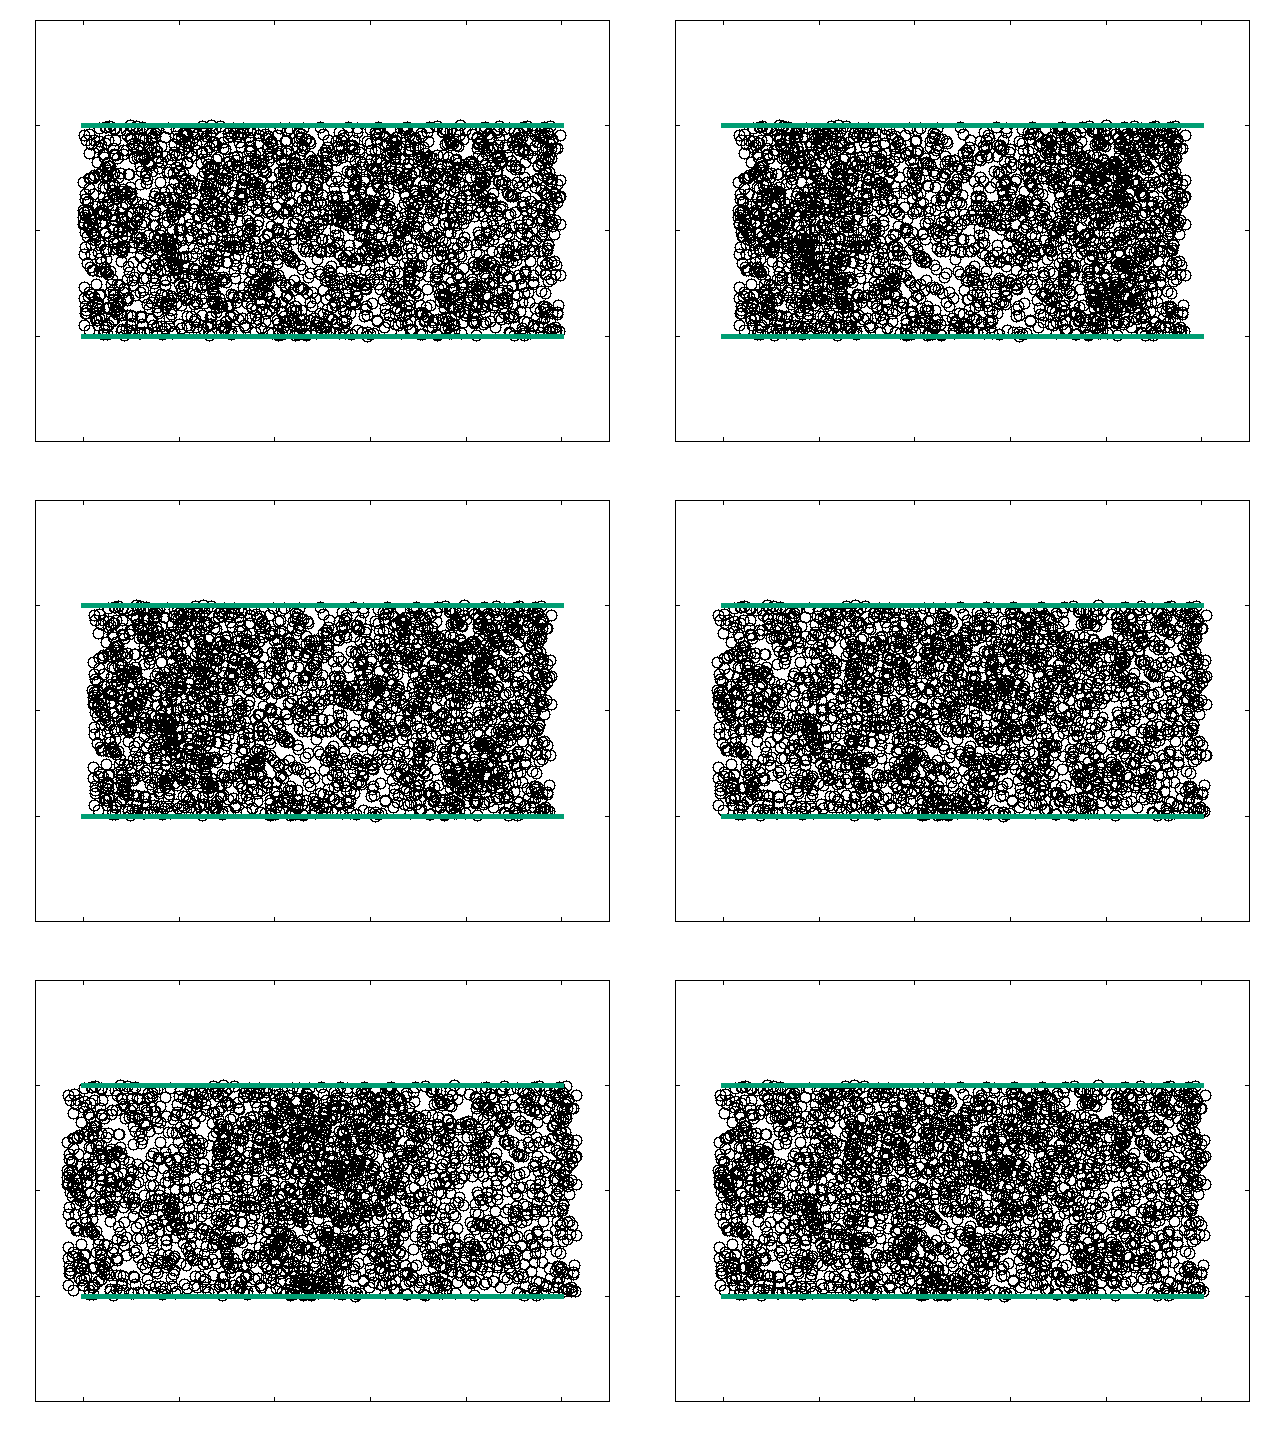
In numerous wind instruments, sound is not produced by a mechanical vibration of some of its parts, but rather by oscillations of an air column. In the following examples, we will show different air columns: Closed-Closed (as the boreophone), Closed-Open (as the pan flute), and Open-Open (as any open tube). The value of in the left column corresponds to the vibration normal mode generated in the column.
| n | Closed-Closed Cavity | Closed-Open Cavity | Open-Open Cavity |
|---|---|---|---|
| 1 | |||
| 2 | |||
| 3 |
#* OSCILLATIONS OF AN AIR COLUMN *#
#* *#
#* This program shows how the air oscillates inside *#
#* cavities (opened and closed) when it is blown, such that *#
#* the air vibrates with a natural frequency to the system. *#
#****************************************************************#
# AUTHOR: FELIPE GONZALEZ CATALDO, November 2015.
from numpy.random import rand
from numpy import pi,sin,cos
N=2500 # Number of particles
L=10 # Length (horizontal)
t=0.0 # time
dt=0.05 # Time step
w=5.0 # Angular frequency
tmax=2*pi/w # One period T=2*pi/w
Nframes = int(tmax/dt)+1
#Cavity="C-C" # closed-closed
#Cavity="C-O" # closed-open
Cavity="O-O" # open-open
n=3 # Normal mode number n
k = n*pi/L
fase = 0.0
if Cavity=="C-O":
k=(2*n-1)*pi/(2*L)
elif Cavity=="O-O":
fase = 0.5*pi
x0=L*rand(N)
y0=rand(N)
x = list(x0)
y = list(y0)
def PrintGnuplot(frame):
print "set xtics format ' '"
print "set ytics format ' '"
# print "set terminal png" # size 600,400"
print "set output '"+str("%02d" % frame)+".png'"
print "plot [-1:11][-0.5:1.5] '-' pt 6 lc -1 ps 2 title '', '-' w l lc 10 lw 5 title '', '-' w l lc 10 lw 5 title '', '-' w l lc 10 lw 5 title '', '-' w l lc 10 lw 5 title '' "
# The points
for i in xrange(N):
print x[i],y[i]
print "e"
# Line below
print 0,0
print L,0
print "e"
# Line at the top
print 0,1
print L,1
print "e"
# Left Vertical Line
print 0,0
if Cavity=="O-O": print 0,0
else: print 0,1
print "e"
# Right Vertical Line
print L,0
if Cavity=="O-O" or Cavity=="C-O": print L,0
else: print L,1
print "e"
def NewPos(x,y,t):
for i in xrange(N):
x[i] = x0[i] + (0.1*L/n)*sin(k*x0[i]+fase)*sin(w*t)
for frame in xrange(Nframes):
PrintGnuplot(frame)
NewPos(x,y,t)
t = t+dt
Executing the program
To execute the program, save the code above as "Air-Columns.py" and execute
This will generate the animation. If you want to save each frame in a png file, remove # to uncomment the line
To join the png pictures in a single, animated gif, see this link
